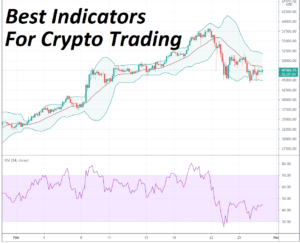
In the intricate world of crypto trading, where precision and timing are paramount, the Relative Strength Index, commonly known as RSI, stands as a beacon for traders. RSI is more than just an indicator; it’s a powerful tool that aids traders in making informed decisions about when to open or close positions in the dynamic cryptocurrency market.
This article marks the continuation of our series on crypto trading, and we are diving deep into the art of using RSI. While RSI is a potent indicator on its own, its true potential shines when combined with other technical tools and chart patterns. We’ve embarked on a case study journey that explores various applications of RSI in the crypto trading landscape. Our aim is to provide you with real-world examples and insights that will enrich your trading strategy, making your decisions more informed and your journey more profitable. Join us as we unlock the potential of RSI and its role in navigating the crypto market’s ebbs and flows.
What is RSI in Crypto and how is it calculated?
In the field of cryptocurrency trading, the Relative Strength Index (RSI) is a widely utilized momentum oscillator. It is an essential tool for traders, assisting them in determining the force and pace of market fluctuations. Traders can make better choices about when to buy or exit positions in the cryptocurrency market by calculating the RSI.
What is RSI?
RSI is a technical indicator that measures the relative changes in price, highlighting overbought and oversold conditions. This oscillator is particularly effective in identifying potential reversal points and confirming trends. RSI values are expressed on a scale from 0 to 100.
How is RSI Calculated?
The RSI calculation is a straightforward process that involves a few steps:
Select a Time Period: First, choose a time period for RSI calculation. The most common period is 14, which means it looks at the last 14 price bars (e.g., 14 hours, 14 days) to assess the crypto’s price momentum.
Gather Price Data: Collect the closing prices of the crypto asset for the selected time period. For each closing price, calculate the price change.
Calculate Average Gain and Loss: Separate the price changes into two categories: gains (positive changes) and losses (negative changes). Calculate the average gain and average loss over the selected time period.
Average Gain: Sum all the positive price changes over the chosen period and divide by the period’s length.
Average Loss: Sum all the negative price changes over the chosen period and divide by the period’s length.
Calculate Relative Strength (RS): The Relative Strength is calculated by dividing the average gain by the average loss:
RS = (Average Gain) / (Average Loss)
Calculate RSI: The final step is calculating the RSI itself. The formula involves converting the RS into an index that ranges from 0 to 100:
RSI = 100 – (100 / (1 + RS))
Traders evaluate the momentum of the cryptocurrency using this final RSI rating. An overbought asset is often indicated by an RSI score above 70, indicating that a potential reversal or correction may be in order. In contrast, a reading below 30 indicates that the asset is typically oversold and may represent a purchasing opportunity.
RSI is a useful tool in cryptocurrency trading for accurately timing market movements. In order to improve trading techniques and make more informed judgments in the constantly shifting cryptocurrency market, it is frequently utilized in conjunction with other indicators and chart patterns.
If you are looking for a crypto broker to day trading or swing trading we recommend Stormgain. Low fees, margin trading, huge variety of crypto – in other words anything you need to start your trading career. Click the banner below and get 25 USDT on your first deposit!

How to use RSI in crypto trading?
The Relative Strength Index (RSI) is a momentum indicator that measures the magnitude of recent price changes to evaluate overbought or oversold conditions in the price of a cryptocurrency. RSI signals can be used for opening and closing positions in crypto trading. However, traders rarely use RSI alone in their trading strategies. Instead, they use it in conjunction with other indicators or chart patterns to get signal confirmation.
Naked RSI
The Naked RSI strategy simply involves looking for the “overbought” and “oversold” zones of the RSI indicator. Traders then open a position opposite to the market right at the peak or bottom of the RSI.
For example, if the RSI is above 70, the trader would open a sell position, betting that the cryptocurrency is overbought and due for a pullback. If the RSI is below 30, the trader would open a buy position, betting that the cryptocurrency is oversold and due for a rebound.
However, the Naked RSI strategy is not very reliable, as it can produce many false signals. This is especially true in volatile markets like the cryptocurrency market.
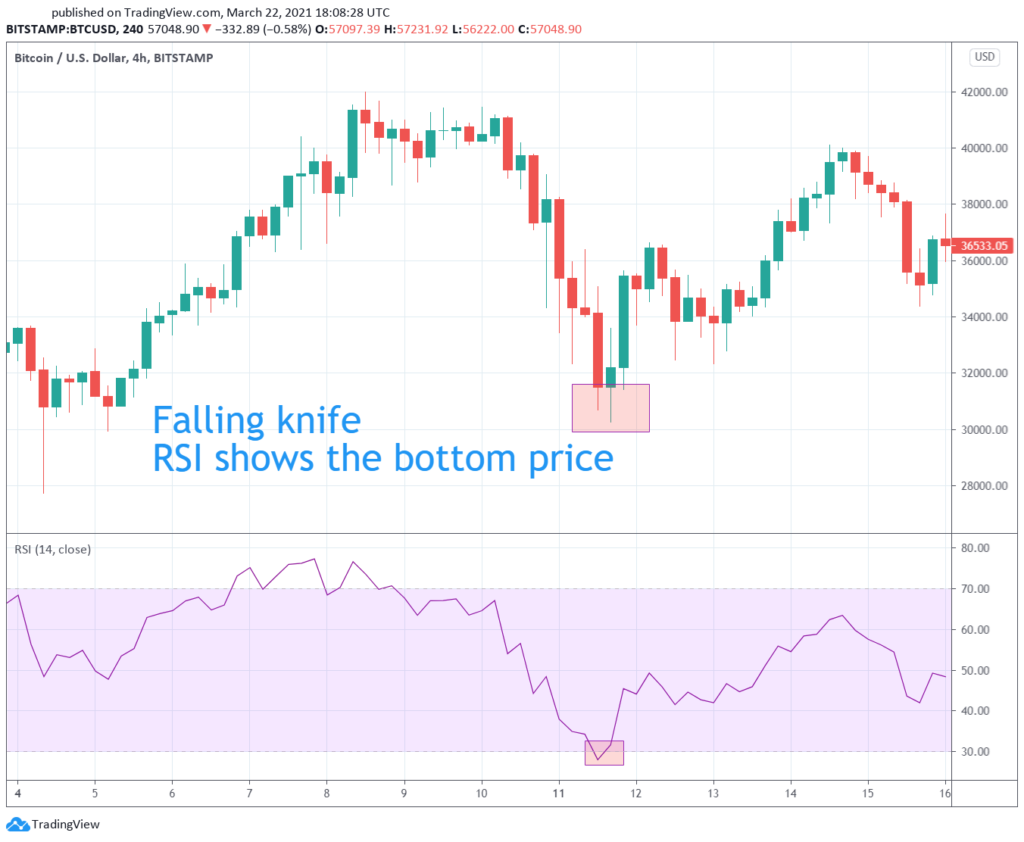
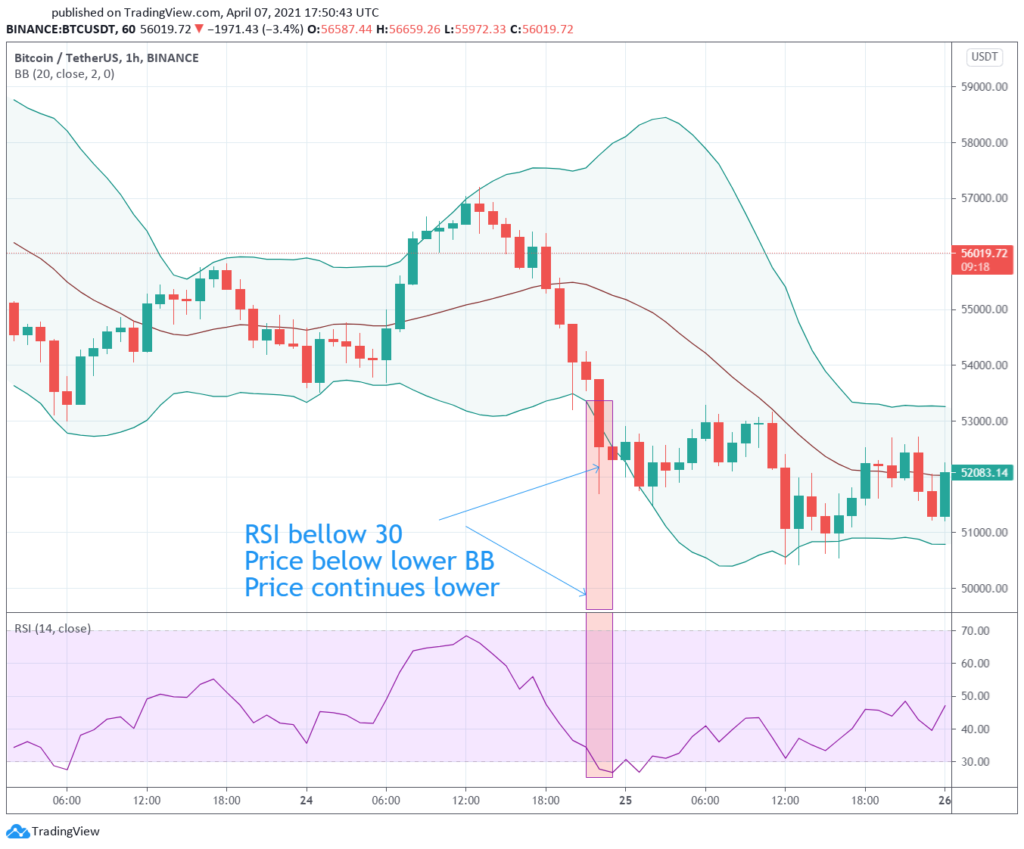
When the price of crypto is falling sharply the strategy metaphorically is called “catching the falling knife”. Meaning that when you are trying to catch a falling knife you either will catch it by the handle or by the blade. So, you will catch the knife or will have a bleeding hand.
Example of “falling knife” and how RSI helps to find the bottom.
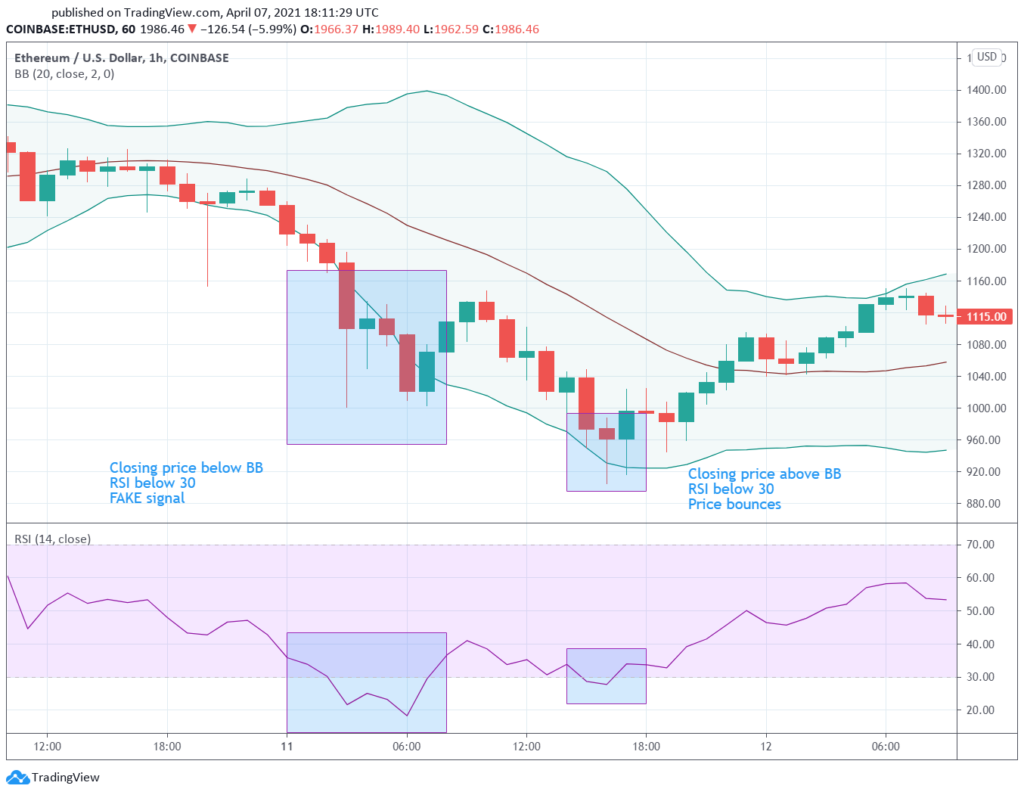
But RSI will show many fake signals if used alone:
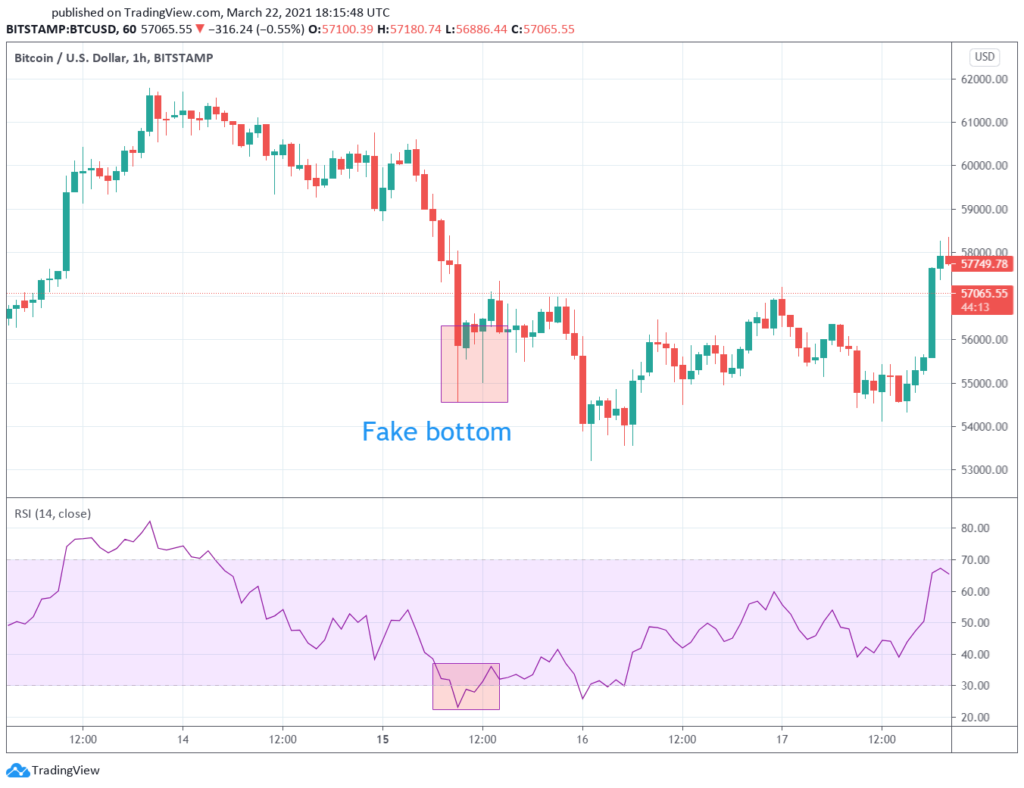
Example of fake signal. Fake bottom followed by minor bounce and then price continues falling lower.
This example shows that RSI on its own will show many signals out of which only few will be profitable. So, the goal of our case study is to find the best way to use RSI and filter out most of the fake signals.
RSI Divergence
RSI divergence is a more sophisticated way to use the RSI indicator. It occurs when the price of a cryptocurrency is moving in one direction, but the RSI is moving in the opposite direction. This can be a sign that a trend reversal is imminent.
For example, if the price of a cryptocurrency is making new highs, but the RSI is making lower highs, this could be a sign that the cryptocurrency is overbought and due for a pullback. Conversely, if the price of a cryptocurrency is making new lows, but the RSI is making higher lows, this could be a sign that the cryptocurrency is oversold and due for a rebound.
Combining RSI with other indicators
RSI can also be combined with other indicators, such as moving averages or MACD, to improve its accuracy. For example, a trader might only buy when the RSI crosses above 30 and the price is above its moving average. Or, a trader might only sell when the RSI crosses below 70 and the price is below its moving average.
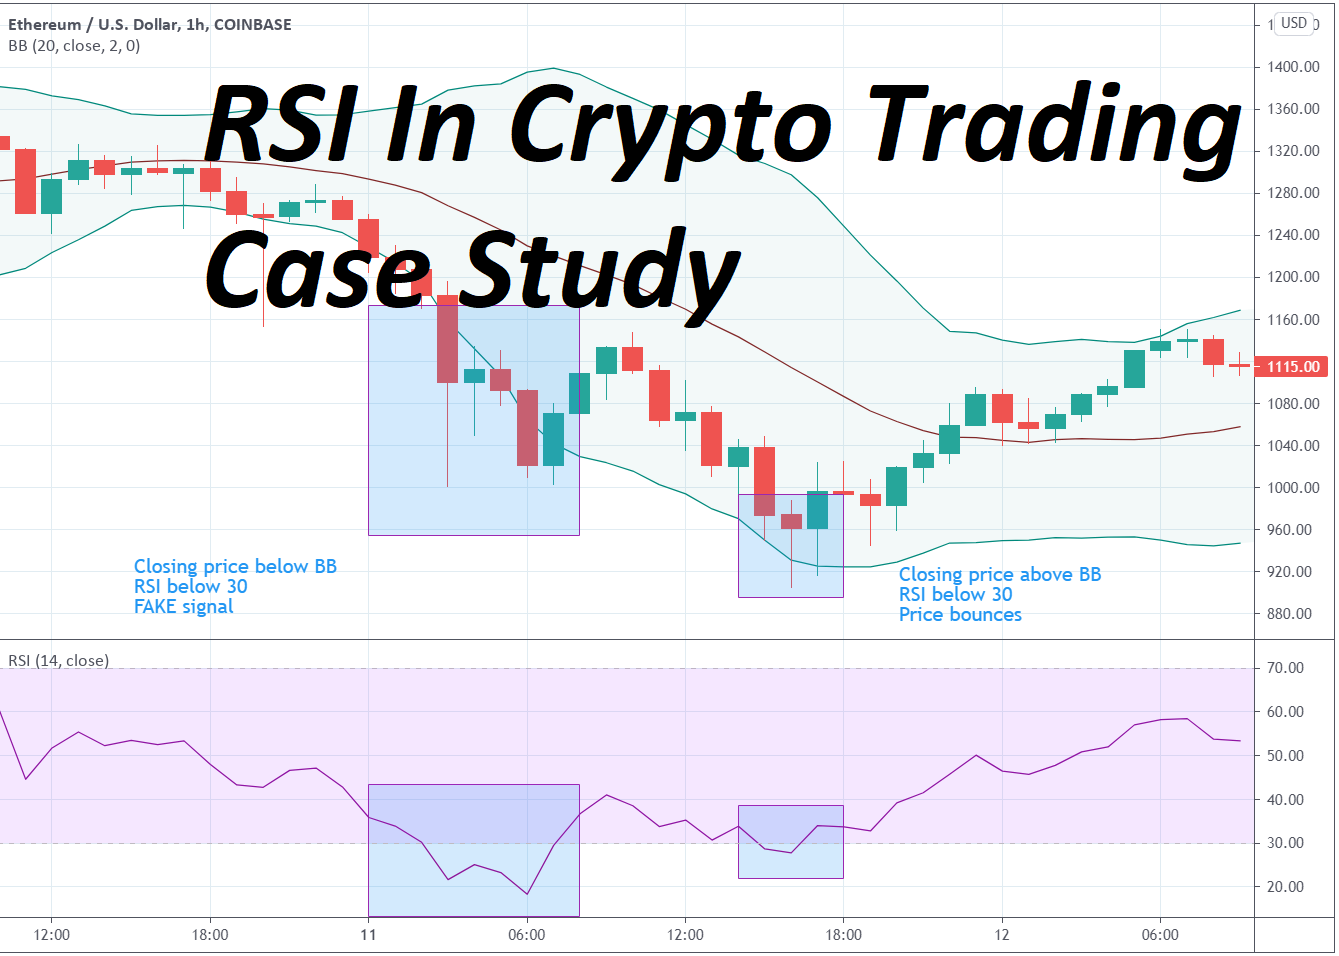
RSI + Bollinger Bands
Bollinger Bands (BB) is a trend indicator that can be used to filter out bad signals from the RSI indicator. RSI is an oscillator that is meant to show where a trend is likely to turn around.
If the price of a cryptocurrency is outside the upper or lower Bollinger Band line, this indicates a strong trend. In this case, RSI signals can be considered fake.
For example, if the price of a cryptocurrency is above the upper Bollinger Band line, this indicates a strong uptrend. If the RSI is below 30 in this case, it is likely a fake signal and the price is unlikely to reverse and trend downwards.
Conversely, if the price of a cryptocurrency is below the lower Bollinger Band line, this indicates a strong downtrend. If the RSI is above 70 in this case, it is likely a fake signal and the price is unlikely to reverse and trend upwards.
And vice versa, if BB shows no trend, we consider RSI signals as market turn around points. Example of this setup below.
How to use RSI + Bollinger Bands in crypto trading
One way to use RSI + Bollinger Bands in crypto trading is to only take buy signals when the RSI crosses above 30 and the price is above the lower Bollinger Band line. Conversely, you would only take sell signals when the RSI crosses below 70 and the price is below the upper Bollinger Band line.
Another way to use RSI + Bollinger Bands is to look for RSI divergence. For example, if the price of a cryptocurrency is making new highs, but the RSI is making lower highs, this could be a sign that the cryptocurrency is overbought and due for a pullback. Conversely, if the price of a cryptocurrency is making new lows, but the RSI is making higher lows, this could be a sign that the cryptocurrency is oversold and due for a rebound.
It is important to note that RSI + Bollinger Bands is not a perfect trading strategy. There will still be times when you get false signals. However, by using these two indicators in conjunction with each other, you can improve your chances of making profitable trades.
Here are some additional tips for using RSI + Bollinger Bands in crypto trading:
Always use stop-loss orders to protect your profits and limit your losses.
Be aware that RSI + Bollinger Bands can produce false signals, especially in volatile markets.
Do not use RSI + Bollinger Bands alone to make trading decisions. Always use other technical analysis tools and chart patterns to confirm signals.
RSI + Chart patterns
RSI can be used in conjunction with chart patterns to improve the accuracy of trading signals. Chart patterns are graphical representations of price movements that can be used to identify potential trend reversals and continuations.
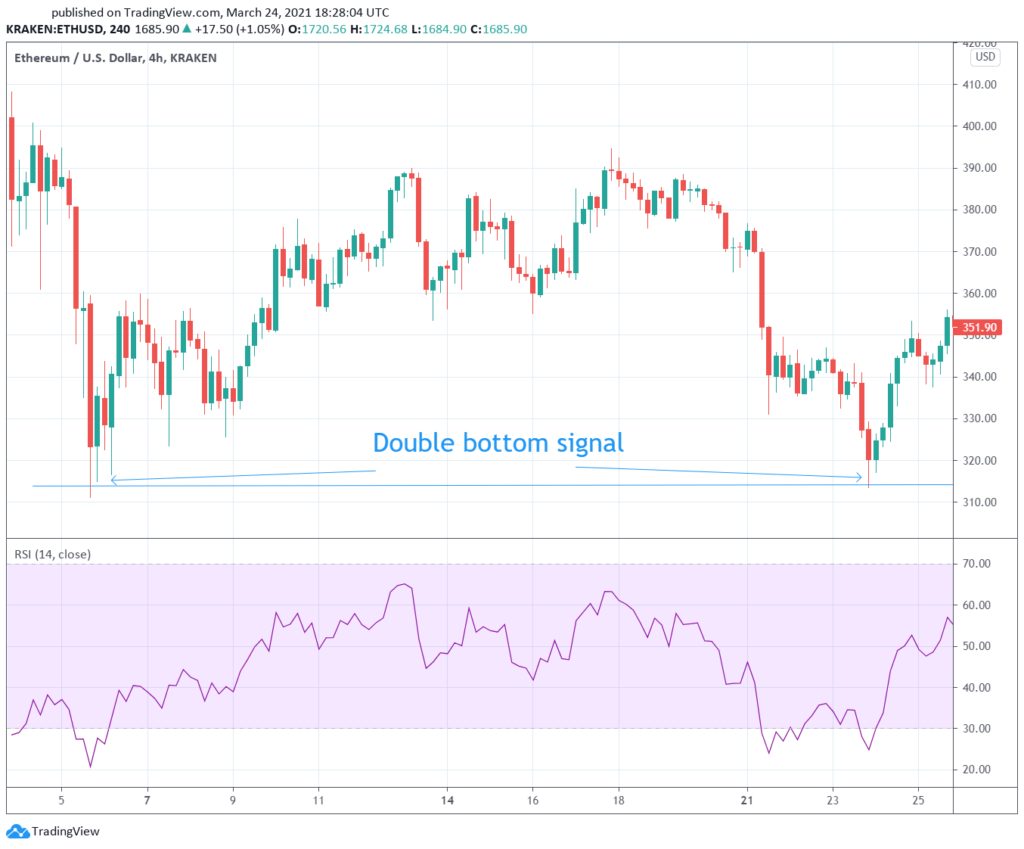
One common chart pattern that can be used with RSI is the double bottom. A double bottom formation occurs when the price of a cryptocurrency makes two consecutive lows at the same level. This suggests that there is strong support at this level and that the cryptocurrency is likely to rebound.
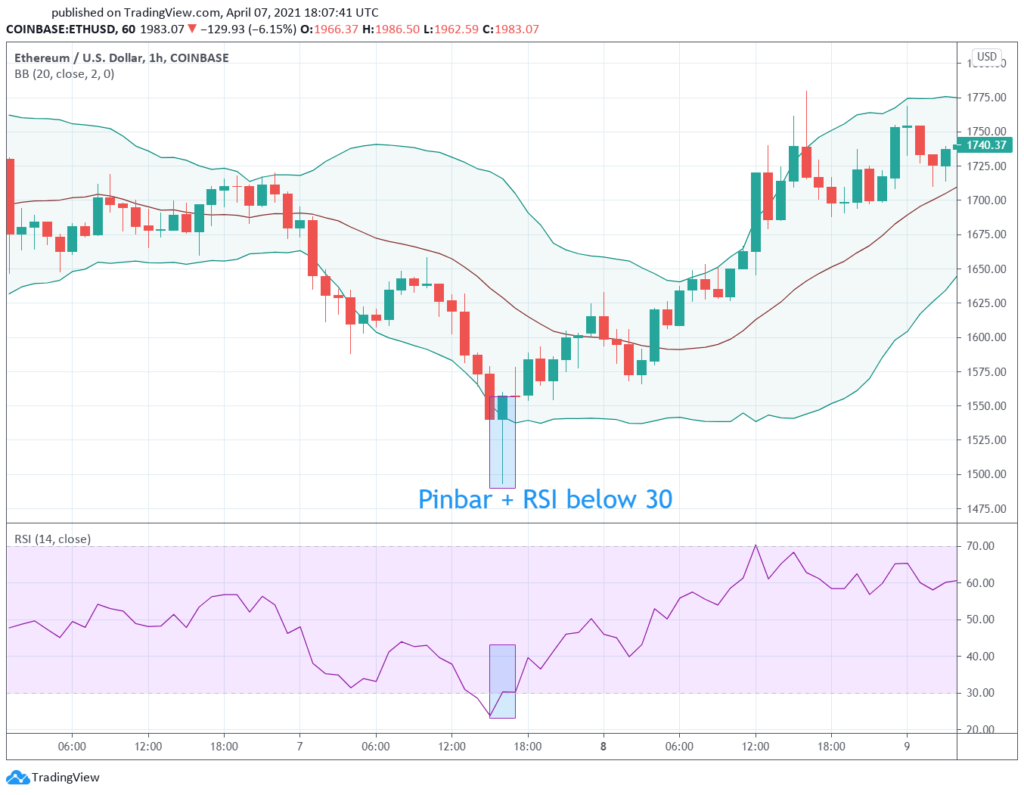
Another common chart pattern that can be used with RSI is the pin bar. A pin bar is a candlestick with a long tail and a short body. It suggests that there is strong buying or selling pressure at the current price level.
To use RSI with chart patterns, traders look for RSI signals that occur in conjunction with chart patterns. For example, if the RSI is below 30 and a double bottom formation is forming, this could be a strong buy signal. Conversely, if the RSI is above 70 and a pin bar is forming with a long upper tail, this could be a strong sell signal.
Here are some examples of how RSI can be used with chart patterns:
RSI + double bottom: If the RSI is below 30 and a double bottom formation is forming, this could be a strong buy signal.
RSI + pin bar: If the RSI is above 70 and a pin bar is forming with a long upper tail, this could be a strong sell signal.
RSI + head and shoulders: If the RSI is above 70 and a head and shoulders pattern is forming, this could be a sign that the cryptocurrency is overbought and due for a pullback.
RSI + inverse head and shoulders: If the RSI is below 30 and an inverse head and shoulders pattern is forming, this could be a sign that the cryptocurrency is oversold and due for a rebound.
It is important to note that RSI + chart patterns is not a perfect trading strategy. There will still be times when you get false signals. However, by using these two tools in conjunction with each other, you can improve your chances of making profitable trades.
Here are some additional tips for using RSI + chart patterns in crypto trading:
Always use stop-loss orders to protect your profits and limit your losses.
Be aware that RSI + chart patterns can produce false signals, especially in volatile markets.
Do not use RSI + chart patterns alone to make trading decisions. Always use other technical analysis tools and fundamental analysis to confirm signals.
Conclusion
Unquestionably, one of the most popular and commonly utilized oscillators in the world of cryptocurrency trading is the Relative Strength Index (RSI). Its importance in assisting traders in locating lucrative chances and foreseeing new trends cannot be overstated. But like any single indicator, RSI has its limitations and occasionally produces false indications.
In actuality, RSI by itself could generate a fair amount of false alerts. To combat this, seasoned cryptocurrency traders use a multidimensional technique that combines RSI with a variety of other indicators to produce a thorough and reliable trading plan. Traders can filter out undesired signals and get a more accurate picture of market conditions by combining RSI with tools like chart patterns, Bollinger Bands, MACD, Stochastic, and others.
The effectiveness of RSI depends on how well it is incorporated into a carefully thought-out plan in the dynamic and frequently stormy world of crypto trading. The trick is to identify the set of indicators that works well as a complement to RSI. Remember that there is no one-size-fits-all solution when you begin your cryptocurrency trading experience. You must investigate and experiment to find the trading methods that suit your particular trading objectives and risk tolerance. You may improve your ability to navigate the cryptocurrency market with better accuracy and confidence by utilizing the power of RSI in conjunction with other tools.